Did67 wrote:Obamot wrote:Pfffffff yet one of those bite-me-the-knot curves where the x-coordinate VS-coordinate scales are presented in a deceptive way and serve for “demonstration” rather than giving the real and unco-rated state of the situation.
Sadly, the great pro-nuclear ideological manipulation of “Over-Watts” continues.
It is, for a clear mind and not lost in the mists of beliefs, a formidable precision!
So for those who are lost in the mists:
a) yes, not starting from "zero" at the ordinate level makes it possible to make the curve and the figures readable
b) yes, for those who are lost in the mists, it seems made to exaggerate the growth (and visually, indeed, it does, like any "zoom effect" - the filmmakers don't do anything else!)
c) it is forbidden for anyone to have a bit of intelligence and "read" that roughly, the average content increases by 2 ppm per year (this must be college math level?)
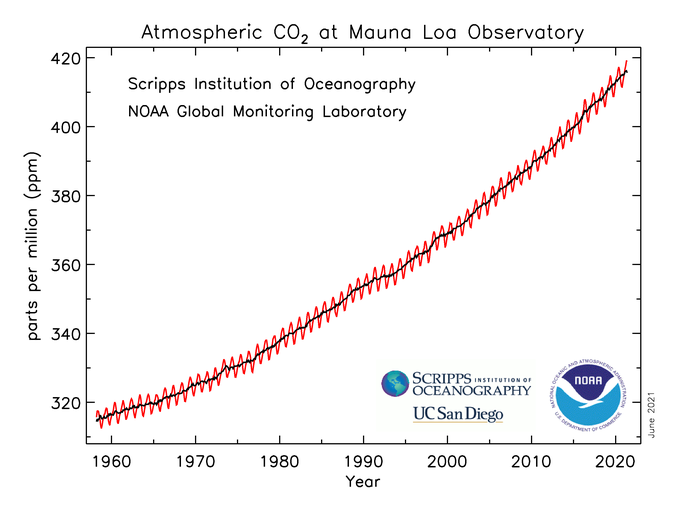
d) for those who did not understand it, the red curve is the monthly averages and the black curve, these same average levels corrected for seasonal variations (it is therefore a kind of smoothing of the averages)
e) the small bars on this black curve mark, elegance of real scientists and not intellectual masturbators, the margin of error (because there is always a margin of uncertainty on measurements, linked to the equipment, the sampling , that a real scientist knows how to calculate and that a real scientist specifies when he publishes data.
For those interested, here is the long series, since the data exist ...
Mauna Loa may not be "the perfect place in the world", although being an island it is windswept and even though Hawaii is not the Ruhr area. The advantage is that it is the longest series of measurements with the same methodology available. And this series is relentless. Here is the graph of the complete series (be careful, it still does not start from zero!)
- 4148336E-AC8F-4D69-91A5-1B222C9DBD29.png (103.35 Kio) Consulté 835 fois
And one next to the other, we understand that a "zoom effect" is needed so that the figures are readable (and therefore not have ordinates that start from zero)
2021-06-20_18h33_57 mauna loa.png
Well thank you, if so, you just demonstrated the exact opposite of what you wanted to do!
Indeed, the curve begins roughly in 1955 and without wanting to be categorical (like you?) There are some inconsistencies with the paradigm of “Anthropogenic warmism”, for example:
- we can by no means say that there was in the sixties, the same degree of emissions of Co
2 that now. the curve should therefore necessarily reflect this, it does not!
- worse, it is almost rectilinear even though emissions have continued to increase: it therefore neither could nor should be so rectilinear, but have increased with demography and what that involved having to heat buildings, by road traffic, industrialization, etc. well no, it is rectilinear;
- even worse, the observatory is in Hawaii, at an altitude of 3m, a place spared by pollution, ideal for displaying good precision in the “average of measurements”, which confirms, with PRECISION, the above inconsistencies , I mean starting from the idea that the anthropogenic part would be the primary cause of warming, in this case, the curve should not be rectilinear ... Alas, you give here a weighty argument to climate skeptics.
- even worse if we take the data from NASA, which establishes the anthropogenic part at 0,33%, the remaining 99,66% being of natural origin and will again be swallowed up in the oceans (for the part which their returns) when the Earth falls again in the next glaciation ... So if we take this argument which is a HEAVY trend, it would imply an almost stable and linear increase,
100% compatible with the rendering of the curve you just posted,Thanks for that,
In addition, I rarely intervene in this debate, I am not a climate skeptic but a realistic one, and for all that, I believe that the public authorities
must do everything to limit emissions. So I have no bias in this saga and do not defend the opinions of any side. This is probably the most sterile debate of this forum!