Okofen Pellmatic boiler dashboard
published: 18/03/22, 21:42
Hello everybody
I've been reading this for quite some time now. forum. I find that the exchanges there are of a high quality and I thank all those who contribute to it, your discussions have nourished my reflection when I was studying the alternative to my old propane boiler. .
.
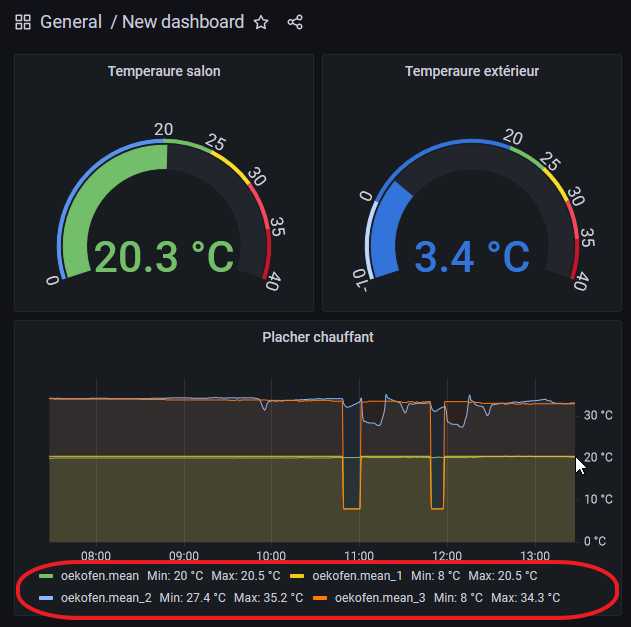
And so that's it, for barely two weeks my house has been equipped with an Okofen Pellmatic compact PES210 pellet boiler coupled with solar collectors for DHW. So far everything is working perfectly . I cross my fingers, but as I am of a cautious nature and I like to know if we are using the resources to their full potential, I would like to create a dashboard to graph all the useful information and analyze it. So I started by connecting the boiler to my local network and enabling JSON. It's good, I manage to recover the information of the boiler (see below).
Well, collecting information is good, but I also have to understand what it means (there is part of the answer here) then store and graph them. So before jumping headlong into configuring a node-red + InfuxDB + Grafana, I poked around the internet a bit to see if other people hadn't already racked their brains a bit on the topic, and I found some interesting stuff:
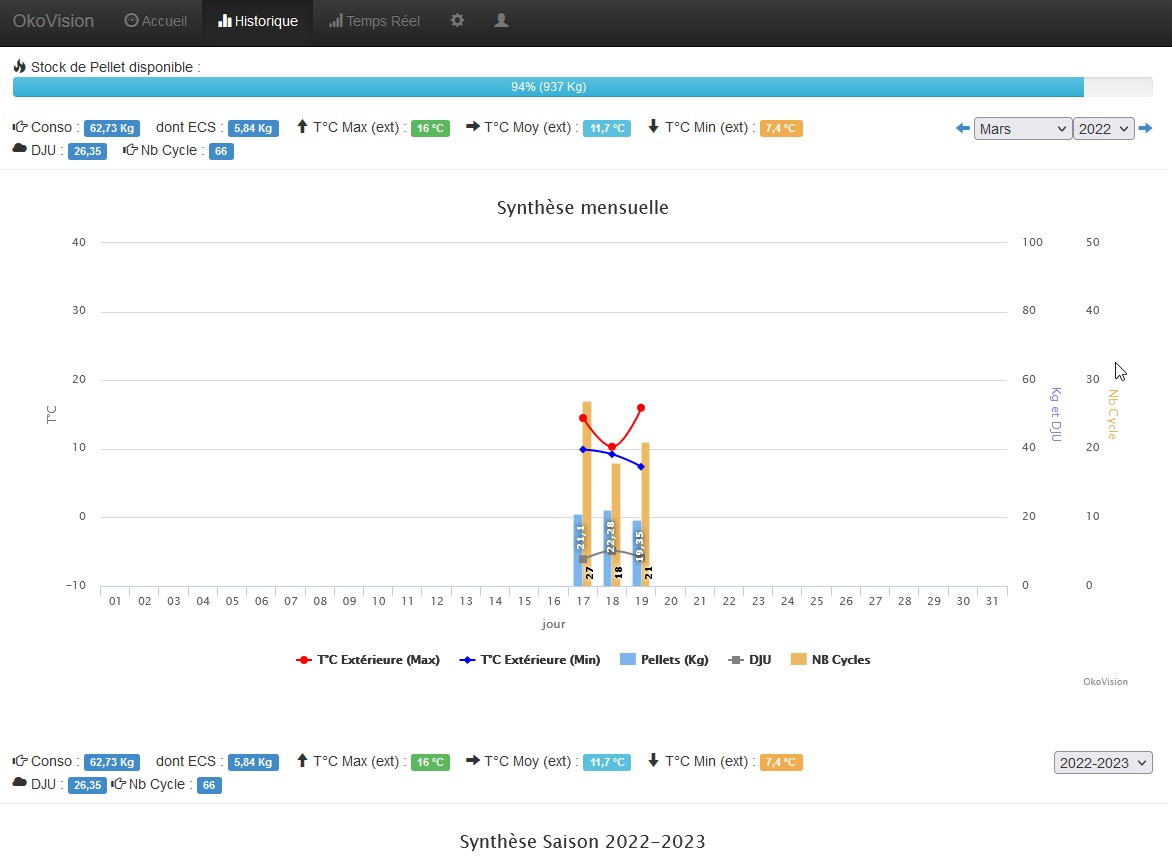
Well, I haven't found anything that suits me perfectly. What I would like is to make time graphs allowing to see the evolution of the data and the operation of the installation (like OkoVision). For example a graph with outdoor temperature + indoor temperature + underfloor heating flow temperature + underfloor heating return temperature + set point + boiler operating ranges. For the DHW tank: Tank temperature, sensor temperature, DHW production by the boiler, etc.
Maybe also add other sensors. Indeed, I do not have the impression that we know the quantity of pellets consumed, and that I would have liked to have it... This information is processed in OkoVision, but I do not know which boiler it is retrieved the information. surely a model that provided this information...
Do any of you already have this kind of dashboard? For which model of machine? What data is there? What would you like to have?...
Here is the data I collect via JSON:
Good night,
Hubert
I've been reading this for quite some time now. forum. I find that the exchanges there are of a high quality and I thank all those who contribute to it, your discussions have nourished my reflection when I was studying the alternative to my old propane boiler.
 .
.And so that's it, for barely two weeks my house has been equipped with an Okofen Pellmatic compact PES210 pellet boiler coupled with solar collectors for DHW. So far everything is working perfectly
Well, collecting information is good, but I also have to understand what it means (there is part of the answer here) then store and graph them. So before jumping headlong into configuring a node-red + InfuxDB + Grafana, I poked around the internet a bit to see if other people hadn't already racked their brains a bit on the topic, and I found some interesting stuff:
- Project OkoVisionwhich looks very cool, but is unfortunately no longer maintained
- OkofenSpywhich looks nice too, developed by a German. But I have doubts about his method of calculating the amount of pellets consumed...
Well, I haven't found anything that suits me perfectly. What I would like is to make time graphs allowing to see the evolution of the data and the operation of the installation (like OkoVision). For example a graph with outdoor temperature + indoor temperature + underfloor heating flow temperature + underfloor heating return temperature + set point + boiler operating ranges. For the DHW tank: Tank temperature, sensor temperature, DHW production by the boiler, etc.
Maybe also add other sensors. Indeed, I do not have the impression that we know the quantity of pellets consumed, and that I would have liked to have it... This information is processed in OkoVision, but I do not know which boiler it is retrieved the information. surely a model that provided this information...
Do any of you already have this kind of dashboard? For which model of machine? What data is there? What would you like to have?...
Here is the data I collect via JSON:
code: Select all
{
 "system":{
  "L_ambient":102,
  "L_errors":0,
  "L_usb_stick":0,
  "L_existing_boiler":0
 },
 "weather":{
  "L_temp":80,
  "L_clouds":100,
  "L_forecast_temp":140,
  "L_forecast_clouds":96,
  "L_forecast_today":0,
  "L_starttime":920,
  "L_endtime":1640,
  "L_source":"http://www.openweathermap.org",
  "L_location":"Saint-Just-Saint-Rambert|FR|6616777",
  "cloud_limit":55,
  "hysteresys":-40,
  "offtemp":-100,
  "lead":120,
  "refresh":0,
  "oekomode":0
 },
 "forecast":{
  "L_w_0":"ven., 18 mars 18:56|8|100|4 km/h|04n|804|C|06:50|18:51",
  "L_w_1":"ven., 18 mars 19:00|8|100|7 km/h|04n|804|C",
  "L_w_2":"ven., 18 mars 22:00|8|99|6 km/h|04n|804|C",
  "L_w_3":"sam., 19 mars 01:00|6|91|2 km/h|04n|804|C",
  "L_w_4":"sam., 19 mars 04:00|5|95|5 km/h|04n|804|C",
  "L_w_5":"sam., 19 mars 07:00|5|75|5 km/h|04d|803|C",
  "L_w_6":"sam., 19 mars 10:00|11|85|2 km/h|04d|804|C",
  "L_w_7":"sam., 19 mars 13:00|14|92|9 km/h|04d|804|C",
  "L_w_8":"sam., 19 mars 16:00|15|100|11 km/h|10d|500|C",
  "L_w_9":"sam., 19 mars 19:00|10|92|4 km/h|10n|500|C",
  "L_w_10":"sam., 19 mars 22:00|8|55|6 km/h|04n|803|C",
  "L_w_11":"dim., 20 mars 01:00|9|76|10 km/h|10n|500|C",
  "L_w_12":"dim., 20 mars 04:00|9|89|12 km/h|04n|804|C",
  "L_w_13":"dim., 20 mars 07:00|7|94|8 km/h|04d|804|C",
  "L_w_14":"dim., 20 mars 10:00|12|72|19 km/h|04d|803|C",
  "L_w_15":"dim., 20 mars 13:00|15|41|15 km/h|03d|802|C",
  "L_w_16":"dim., 20 mars 16:00|15|60|17 km/h|04d|803|C",
  "L_w_17":"dim., 20 mars 19:00|10|80|12 km/h|04n|803|C",
  "L_w_18":"dim., 20 mars 22:00|7|93|8 km/h|04n|804|C",
  "L_w_19":"lun., 21 mars 01:00|4|55|8 km/h|04n|803|C",
  "L_w_20":"lun., 21 mars 04:00|3|12|8 km/h|02n|801|C",
  "L_w_21":"lun., 21 mars 07:00|3|10|6 km/h|01d|800|C",
  "L_w_22":"lun., 21 mars 10:00|11|0|11 km/h|01d|800|C",
  "L_w_23":"lun., 21 mars 13:00|15|0|14 km/h|01d|800|C",
  "L_w_24":"lun., 21 mars 16:00|15|5|17 km/h|01d|800|C"
 },
 "hk1":{
  "L_roomtemp_act":211,
  "L_roomtemp_set":80,
  "L_flowtemp_act":342,
  "L_flowtemp_set":80,
  "L_comfort":0,
  "L_state":2080,
  "L_statetext":"Mode confort actif|T ambiante atteinte",
  "L_pump":0,
  "remote_override":0,
  "mode_auto":1,
  "time_prg":0,
  "temp_setback":210,
  "temp_heat":210,
  "temp_vacation":150,
  "name":"plancher cha",
  "oekomode":0,
  "autocomfort":-1,
  "autocomfort_sunset":0,
  "autocomfort_sunrise":0
 },
 "hk2":{
  "L_roomtemp_act":0,
  "L_roomtemp_set":200,
  "L_flowtemp_act":354,
  "L_flowtemp_set":362,
  "L_comfort":0,
  "L_state":32,
  "L_statetext":"Mode confort actif",
  "L_pump":1,
  "remote_override":0,
  "mode_auto":1,
  "time_prg":0,
  "temp_setback":180,
  "temp_heat":200,
  "temp_vacation":150,
  "name":"Radiateurs",
  "oekomode":0,
  "autocomfort":-1,
  "autocomfort_sunset":0,
  "autocomfort_sunrise":0
 },
 "ww1":{
  "L_temp_set":500,
  "L_ontemp_act":574,
  "L_offtemp_act":574,
  "L_pump":0,
  "L_state":8208,
  "L_statetext":"t dans prog horaire|Demande marche off",
  "time_prg":0,
  "sensor_on":0,
  "sensor_off":0,
  "mode_auto":1,
  "mode_dhw":1,
  "heat_once":0,
  "temp_min_set":380,
  "temp_max_set":550,
  "name":"",
  "smartstart":0,
  "use_boiler_heat":0,
  "oekomode":0
 },
 "pe1":{
  "L_temp_act":817,
  "L_temp_set":80,
  "L_ext_temp":-32768,
  "L_frt_temp_act":6157,
  "L_frt_temp_set":80,
  "L_frt_temp_end":80,
  "L_br":0,
  "L_ak":0,
  "L_not":1,
  "L_stb":1,
  "L_modulation":0,
  "L_runtimeburner":0,
  "L_resttimeburner":0,
  "L_currentairflow":0,
  "L_lowpressure":630,
  "L_lowpressure_set":630,
  "L_fluegas":34,
  "L_uw_speed":100,
  "L_state":5,
  "L_statetext":"Mise à l'arrêt",
  "L_type":9,
  "L_starts":248,
  "L_runtime":173,
  "L_avg_runtime":41,
  "L_uw_release":600,
  "L_uw":100,
  "L_storage_fill":6000,
  "L_storage_min":400,
  "L_storage_max":6000,
  "L_storage_popper":0,
  "storage_fill_today":0,
  "storage_fill_yesterday":0,
  "mode":1
 },
   "error":{
   }
}
Good night,
Hubert


