Selective sorting: evolution of the weight of the waste since 2004

Environmental impact of end of life products: plastics, chemicals, vehicles, agri-food marketing. direct recycling and recycling (upcycling or upcycling) and reuse of good items for the trash!
Christophe
Moderator
Moderator
posts: 79289
Registration: 10/02/03, 14:06
Location: Greenhouse planet
x 11025

Selective sorting: evolution of the weight of the waste since 2004


by Christophe » 15/12/08, 11:53

Following this topic https://www.econologie.com/forums/tri-select ... t6547.html and the measurements and surveys carried out by A2E since 2004, I was able to draw some very interesting curves on household waste. A2E correct me if I say stupidity.

A) These are monthly statements of the weight of waste classified by type of waste according to this classification:

- Plastics
- Cardboard newspapers
- Glasses
- Metals
- Composting
- WEEE
- Homemade incineration
- Publicity
- Other waste

B) It concerns a family of 3 adults on average.

C) Surveys carried out between October 2004 and October 2008, ie over 4 complete years.

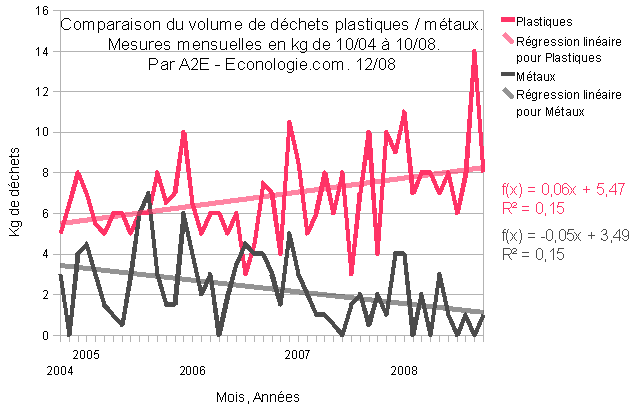
For each curve I drew the linear curve (= right) of correlation. The coefficient before the x gives the increase (if positive coefficient) or the decrease (if negative coefficient) per month of the volume of waste. Example for plastics (pink) we have a coef. 0.06. This means that between 2004 and 2008, on average, there was an additional 60 grams of plastic waste per month.

Or an increase of 60 * 12 * 4 = 2.8 kg / month over 4 years ...

D) The A2E hearth is however particularly clean because the average waste per French person is 360 kg / year. The A2E outbreak is at 530 kg / year over the 4 years, ie 530/3 = 177 kg / inhabitant.year 51% less than the national average, including composting!

E) The WEEE peak in July 2008 corresponds to the change of: 1 washing machine + 1 tv + 1 PC monitor (would you have taken lightning A2E?)

Let's go!

I) volume per year:

Image
0 x
Christophe
Moderator
Moderator
posts: 79289
Registration: 10/02/03, 14:06
Location: Greenhouse planet
x 11025


by Christophe » 15/12/08, 12:14

And here are the evolution curves, waste by waste with the same color code as the previous diagram.

II) Plastic waste

Image

Increase of 60 grams per month or +2.8 kg / month over 4 years.

III) Papers and newspapers

Image

Increase of 30 grams per month or +1.4 kg / month over 4 years.
Last edited by Christophe the 15 / 12 / 08, 12: 24, 1 edited once.
0 x
Christophe
Moderator
Moderator
posts: 79289
Registration: 10/02/03, 14:06
Location: Greenhouse planet
x 11025


by Christophe » 15/12/08, 12:20

IV) Glass

Image

Increase of 10 grams per month or +0.48 kg / month over 4 years.

V) Metals

Image

Reduction of 50 grams per month or - 2.4 kg / month over 4 years.
Probably for the "benefit" of plastics.
0 x
Christophe
Moderator
Moderator
posts: 79289
Registration: 10/02/03, 14:06
Location: Greenhouse planet
x 11025


by Christophe » 15/12/08, 12:36

VI) Compostable (and composted) waste

Image

Reduction of 20 grams per month or - 0,96 kg / month over 4 years.

The decrease indicates:
a) less food waste?
b) fewer people at home so cutlery served?

VII) WEEE (Waste equipment, electrical and electronic)

Image

For this curve, I did not draw the trend curve because it is not very significant given the few measurement points and the peak in July 2008 corresponding to the change: from a washing machine, from a TV and a PC monitor.

The "smallest" annual peaks correspond to the end of the year every year, so I guess these are "Christmas gifts" that have replaced old hardware?
0 x
Christophe
Moderator
Moderator
posts: 79289
Registration: 10/02/03, 14:06
Location: Greenhouse planet
x 11025


by Christophe » 15/12/08, 13:09

VIII) "house incineration" (A2E will explain in more detail what it is)

Image

IX) Advertisements

Image

Advertising is the strongest growth, 90 grams more per month over 4 years! Over these 4 years we therefore receive 4.32 kg more per month !!

This is typical of today's overconsumption society.

It would be interesting to see the evolution of this with the crisis. A2E continues well STP to make the readings! :)

The last category "other waste" is not significant enough to draw a curve.
0 x
Christophe
Moderator
Moderator
posts: 79289
Registration: 10/02/03, 14:06
Location: Greenhouse planet
x 11025


by Christophe » 15/12/08, 14:05

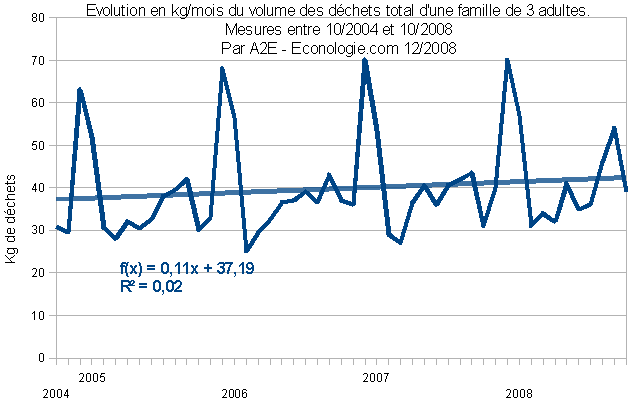
And here are 2 last curves on the evolution of total waste (not in the right direction despite the so-called "effort of society to reduce waste").

Image

The peak of WEEE in July 2008 somewhat misleads the trend, so I deleted it to put an average value:

Image

Some analyzes:

a) Without surprise the most months grimey are located at the end of the year: November and December. With the peak still in November. Reasons? Excessive advertising, gifts, meals ... On the other hand, if I expected it, I did not think that it would double the monthly volume of waste, from 35kg / month we go to 70 kg / month.

Conversely, January is the "cleanest" month, so much the better it leaves a little respite for the garbage collectors ... and the planet after the euphoria of the end of the year ...

b) The waste trend is "clearly" on the rise and the A2E focus is clearly BELOW the national average. Yet he makes "efforts" (well, what most people call effort, I call that common sense).

Reason? Growth, overconsumption, hypermaketing ...

I can't wait to see how the current "so-called" crisis will affect the volume of waste ... if it doesn't drop, there is NO crisis ...
0 x
Christophe
Moderator
Moderator
posts: 79289
Registration: 10/02/03, 14:06
Location: Greenhouse planet
x 11025


by Christophe » 15/12/08, 14:36

And a last one for the road:

Image
0 x
User avatar
Gregconstruct
Econologue expert
Econologue expert
posts: 1781
Registration: 07/11/07, 19:55
Location: Amay Belgium


by Gregconstruct » 15/12/08, 19:08

Nice job Christophe and thank you to A2E for its surveys!

We notice that despite the efforts that we, individuals, can make it is difficult to see our waste "nest egg" decrease.
Perhaps the best would be to return "unjustified" waste to those who produce it ...

Now, it remains to be seen the feasibility of this idea !!!
0 x
Every action counts for our planet !!!
User avatar
swift2540
Éconologue good!
Éconologue good!
posts: 383
Registration: 04/08/08, 00:48
Location: Liege
x 1


by swift2540 » 15/12/08, 21:03

Gregconstruct wrote:Perhaps the best would be to return "unjustified" waste to those who produce it ...
Now, it remains to be seen the feasibility of this idea !!!

: Idea: Easy Greg:
Last year, I collected the envelopes "postage paid by the recipient. (Credit offer, vpc, magazines ...)
One rotten afternoon, I opened the "old paper" box to the children with the instruction "must be consistent".
I tell you not the head of the banker when he saw, religiously cut by my daughter 3 barbies + a bunch of accessories with the mention: would you agree to give me a small credit of 544.89 €? It's for buying that! : Cheesy:
Needless to say, all the shipments were more than 50grams, for them to pay a surcharge, of course : Cheesy: : Cheesy:

Nice work Christophe
0 x
User avatar
Gregconstruct
Econologue expert
Econologue expert
posts: 1781
Registration: 07/11/07, 19:55
Location: Amay Belgium


by Gregconstruct » 15/12/08, 21:12

Great your idea swift2540

I just found an activity for my little cousins ​​during the Christmas holidaysImage
0 x
Every action counts for our planet !!!


  • Similar topics
    Replies
    views
    Last message

Back to "waste, recycling and reuse of old objects"

Who is online ?

Users browsing this forum : No registered users and 61 guests