Page 1 on 2
Map of proven oil reserves in 2009
published: 18/07/12, 11:22
by Christophe
Proven oil reserves in 2009 via 3 maps / graphics:


See also: the comparative Hubbert curve in 1999 and 2009:
https://www.econologie.com/forums/peakoil-et ... 11940.html and the evolution of the price of a barrel:
https://www.econologie.com/forums/prix-du-pe ... 11939.html
published: 18/07/12, 14:54
by Obamot
It is difficult to read on the first. Do you have a link?
It seems that the evaluations have not changed (and even increased according to the first) which would mean that the doubling of oil at the pump is purely fictitious!
If so, when will there be a 50% tax on the price at the pump, making it possible to finance renewable energy? (thank you Holland, ok I -> [])
published: 18/07/12, 15:30
by Christophe
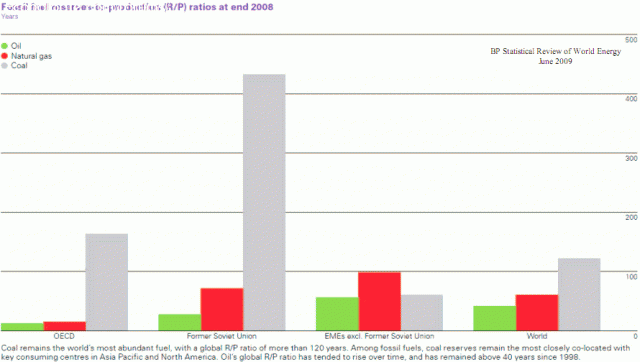
No, this comes from a .pdf from a training organization that I cannot distribute in full (we must find it via the source "BP")
Here is a "zoom":


Worse from your remark, it is interesting to note that
Proven reserves increase in absolute value!
published: 18/07/12, 18:28
by Did67
What I find weird is that all of Europe is in I do not remember which beige: 13 to 20 years of "reserves / production" ratio. I didn't know we had so much oil!
published: 18/07/12, 20:54
by moinsdewatt
Christophe wrote:No, this comes from a .pdf from a training organization that I cannot distribute in full (we must find it via the source "BP")
This is the BP Statistic Review that comes out every year in June.
I've been reading it for years.
you can go here to charge him:
http://www.oleocene.org/phpBB3/viewtopi ... 68#p320568
the pdf live, your figures are in 7 page.
http://www.bp.com/assets/bp_internet/gl ... t_2012.pdf
published: 18/07/12, 21:01
by Christophe
Thanks lessdewatts!
Backup copy of .pdf:
https://www.econologie.info/share/partag ... 2bHl7O.pdf
Did67 wrote:What I find weird is that all of Europe is in I do not remember which beige: 13 to 20 years of "reserves / production" ratio. I didn't know we had so much oil!
You forget the North Sea!
Beware of the misinterpretation of this map: it does not mean X years of oil autonomy but the current local production has a life of X years ...
published: 18/07/12, 21:01
by moinsdewatt
Did67 wrote:What I find weird is that all of Europe is in I do not remember which beige: 13 to 20 years of "reserves / production" ratio. I didn't know we had so much oil!

it is "reserves / production" and not "reserves / consumption"
So we finish the oil from the North Sea, and then it's almost done.
published: 19/07/12, 08:46
by the middle
Be careful that oil extraction techniques change.
For example, the injection of water to remove the last drop, can save many years ...
published: 19/07/12, 08:59
by Obamot
Of course he could not "stay more" in 2008 than 1998 ...
Or so of two things one, they absolutely did not know then, how many were actually the reserves, or they were wrong in the evaluations ...
In one case as in the other it is serious! Because if it is repeated, we could very well arrive at the peak oil faster than expected, and then there ...
We can consider the stock market crash as epiphenomena in comparison with what lies ahead.
published: 19/07/12, 09:11
by the middle
Obamot wrote:Of course he could not "stay more" in 2008 than 1998 ...
Or so of two things one, they absolutely did not know then, how many were actually the reserves, or they were wrong in the evaluations ...
In one case as in the other it is serious! Because if it is repeated, we could very well arrive at the peak oil faster than expected, and then there ...
We can consider the stock market crash as epiphenomena in comparison with what lies ahead.
No risk, there is a whole range of means of replacement.
All these means are not clean of course ...


