
The average trend increase in temperatures in some regions is accelerating: it has been higher in the last decade (compared to the average for the period studied - roughly, the last 40 or 50 years).
I no longer have all the reports in mind, but this is reported ...
The latest figures and weather consequences of global warming
Re: The latest figures from global warming
ABC2019 wrote:I have never said otherwise, nor denied the average warming. But the argument to show it is the one you give: the analysis of the trend over long periods. The observation of ONE "extraordinary" fluctuation does not prove this warming, that's all.
OKAY.
If we agree that the trend is increasing, then the "peaks", of the same intensity, are higher and higher ...
And so the "extremes" (records) that we reach, still have a link. It is not the peak that proves something. It is the fact that the peak is higher than those so far ...
- if the adjustment line is horizontal, the peaks are "stable" (even if there are ten-year, centennial maxi, etc.)
- if the line goes up, they are gradually higher ...
0 x
Re: The latest figures from global warming
Did67 wrote:ABC2019 wrote:I have never said otherwise, nor denied the average warming. But the argument to show it is the one you give: the analysis of the trend over long periods. The observation of ONE "extraordinary" fluctuation does not prove this warming, that's all.
OKAY.
If we agree that the trend is increasing, then the "peaks", of the same intensity, are higher and higher ...
- if the adjustment line is horizontal, the peaks are "stable" (even if there are ten-year, centennial maxi, etc.)
- if the line goes up, they are gradually higher ...
In fact when you consider "records", they always follow a slope, since by definition each one beats the previous one.
You can always say that "oh yes this one broke the previous record and as I know that there is a trend, it confirms the trend", but in reality it is very difficult to know statistically if the record SHOWS the trend, or just is consistent with a trend or nothing. Unless the trend in itself caused the bottom signal to increase well beyond the previous record, but this is far from the case here.
In short, an isolated record will only confirm what you already know elsewhere.
But it is dangerous as a way of reasoning because in the same way it can very easily comfort you in a wrong belief.
This does not mean that I deny the RC, just to draw attention to the risk of attributing anything and everything to it.
0 x
To pass for an idiot in the eyes of a fool is a gourmet pleasure. (Georges COURTELINE)
Mééé denies nui went to parties with 200 people and was not even sick moiiiiiii (Guignol des bois)
Mééé denies nui went to parties with 200 people and was not even sick moiiiiiii (Guignol des bois)
Re: The latest figures from global warming
Did67 wrote:The average trend increase in temperatures in certain regions is accelerating: it has been higher in the last decade (compared to the average for the period studied - roughly, the last 40 or 50 years) ....
it would surprise me that it is observed everywhere ... do you have a reference?
Slopes over different durations should not be compared because the variability means that the amplitude of variation of the slope always increases on shorter data. The trend of the increase in temperature over a day can easily be several ° C per hour or ... several thousand ° C per year (!!), that over 6 months of several ° C per month or several tens of ° C per year, that over 2 years can easily be several tens of ° C per century, etc, etc ... (obviously these figures do not make sense since the extrapolation is not justified, but it is always the case for short durations).
0 x
To pass for an idiot in the eyes of a fool is a gourmet pleasure. (Georges COURTELINE)
Mééé denies nui went to parties with 200 people and was not even sick moiiiiiii (Guignol des bois)
Mééé denies nui went to parties with 200 people and was not even sick moiiiiiii (Guignol des bois)
-
izentrop
- Econologue expert

- posts: 13707
- Registration: 17/03/14, 23:42
- Location: picardie
- x 1521
- Contact :
Re: The latest figures from global warming
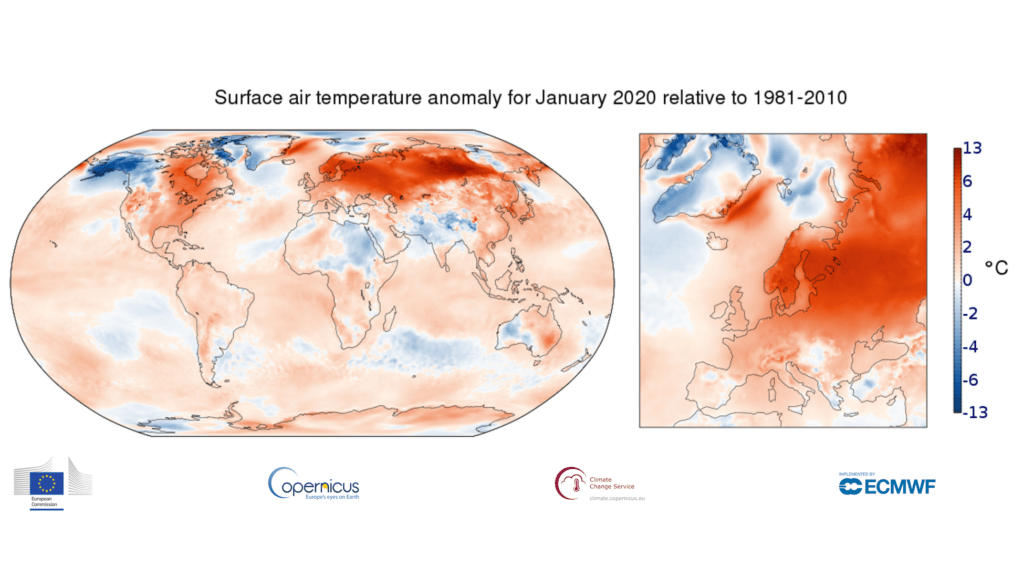
Still and difficult to challenge it, even if locally it means nothing.The year 2019 was the year of many climate records: the historic warming of the oceans is emblematic. The year 2020 does not start much better. A Copernicus Service bulletin on climate change (within the framework of the European Union) provides data showing that January 2020 was warmer than any other January ever recorded in the world. The warming is 1,4 degrees compared to the pre-industrial era. https://www.numerama.com/sciences/60392 ... tique.html
0 x
Re: The latest figures from global warming
izentrop wrote:Still and difficult to challenge it, even if locally it means nothing.
certainly ! I do not dispute
- neither the trend
- nor the record
- nor the fact that the record MAY be linked to the trend
I just dispute the fact that a record can still be taken as PROOF of the trend.
For example, the recent record measured on the Antarctic peninsula arrived when the warming trend of this peninsula was positive until 2000, but negative since ...
0 x
To pass for an idiot in the eyes of a fool is a gourmet pleasure. (Georges COURTELINE)
Mééé denies nui went to parties with 200 people and was not even sick moiiiiiii (Guignol des bois)
Mééé denies nui went to parties with 200 people and was not even sick moiiiiiii (Guignol des bois)
Re: The latest figures from global warming
ABC2019 wrote:it would surprise me that it is observed everywhere ... do you have a reference?
The ORACLE reports cited (there is still one for Aquitaine, at least). In some regions there are very clear differences. In Aquitaine, between Corrèze and Landes, for example ... For certain aspects (rain, FTE, temperatures, number of frost days, number of summer days, etc.)
I had peeled, I can't remember which one.
Note that this brings together both the regional chambers of agriculture (not "eco-bobos" strictly speaking), MétéoFrance (normally, not either), research organizations, the regions ... Before publication, I suppose that everything it was weighed and reweighed. And is scientifically pretty solid. In particular when for some stations the data are not strong enough, this is indicated.
0 x
Re: The latest figures from global warming
ABC2019 wrote:
I just dispute the fact that a record can still be taken as PROOF of the trend.
Or on the contrary!
But again, we are not in front of a record, which happened to happen there. When 2 years out of 3, we note records, it is still not a proof, but a credible index ...
When today 6 athletes go below 10 seconds in the 100 m (I don't know how many there are in reality), whereas 30 years ago, we won the Olympic Games with 10,3 seconds, that means that 'there has been progress in terms of childbirth techniques, professionalization, nutrition, doping ...
I think the climate is also a little better nourished (by CO2) and slightly doped by humans ...
0 x

Re: The latest figures from global warming
Hello,
First message on the forum
Regarding heat records, Météofrance had laid an article a few months ago (after this summer's records). The bottom line is that for each additional degree of average, we can expect the heat records to be statically pushed back by 3 ° C
This was verified (still statically) between the beginning of the 20th century and the 2010s (almost 2 ° C higher on average in summer in France)
We can expect that the 50 ° C mark will be reached in mainland France in the decades to come, probably before 2050 or even much earlier ...
0 x
-
GuyGadebois

- Econologue expert
- posts: 6532
- Registration: 24/07/19, 17:58
- Location: 04
- x 982
Re: The latest figures from global warming
Paul72 wrote:We can expect that the 50 ° C mark will be reached in mainland France in the decades to come, probably before 2050 or even much earlier ...
Great, we will be able to cook slowly at low temperature simply by putting food in a black metal box in the sun! Yippee !!!!
0 x
“It is better to mobilize your intelligence on bullshit than to mobilize your bullshit on intelligent things. (J.Rouxel)
"By definition the cause is the product of the effect". (Tryphion)
"360 / 000 / 0,5 is 100 million and not 72 million" (AVC)
"By definition the cause is the product of the effect". (Tryphion)
"360 / 000 / 0,5 is 100 million and not 72 million" (AVC)
-
- Similar topics
- Replies
- views
- Last message
-
- 360 Replies
- 31501 views
-
Last message by sicetaitsimple
View the latest post
19/04/24, 21:04A subject posted in the forum : Climate change: CO2, warming, greenhouse ...
-
- 19 Replies
- 5314 views
-
Last message by GuyGadeboisTheBack
View the latest post
25/07/22, 23:11A subject posted in the forum : Climate change: CO2, warming, greenhouse ...
-
- 106 Replies
- 22046 views
-
Last message by gegyx
View the latest post
07/10/22, 21:58A subject posted in the forum : Climate change: CO2, warming, greenhouse ...
-
- 1 Replies
- 3624 views
-
Last message by GuyGadeboisTheBack
View the latest post
06/12/21, 00:21A subject posted in the forum : Climate change: CO2, warming, greenhouse ...
-
- 1 Replies
- 3502 views
-
Last message by humus
View the latest post
10/11/21, 07:41A subject posted in the forum : Climate change: CO2, warming, greenhouse ...
Back to "Climate Change: CO2, warming, greenhouse effect ..."
Who is online ?
Users browsing this forum : No registered users and 123 guests