The latest figures and weather consequences of global warming

Warming and Climate Change: causes, consequences, analysis ... Debate on CO2 and other greenhouse gas.
moinsdewatt
Econologue expert
Econologue expert
posts: 5111
Registration: 28/09/09, 17:35
Location: Isére
x 554

Re: The latest figures from global warming


by moinsdewatt » 29/11/18, 22:27

CO2 at Mauna Loa available in November 2018: 406 ppm
source: http://www.esrl.noaa.gov/gmd/webdata/cc ... nd_mlo.pdf

Image


since 1960:

Image

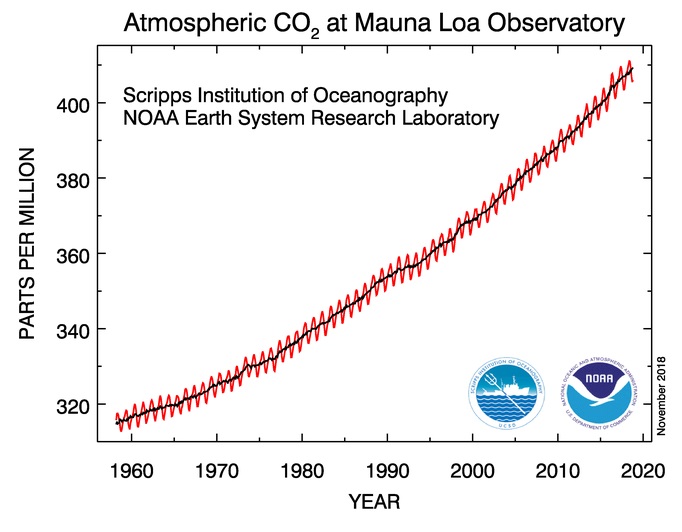
https://www.esrl.noaa.gov/gmd/obop/mlo/
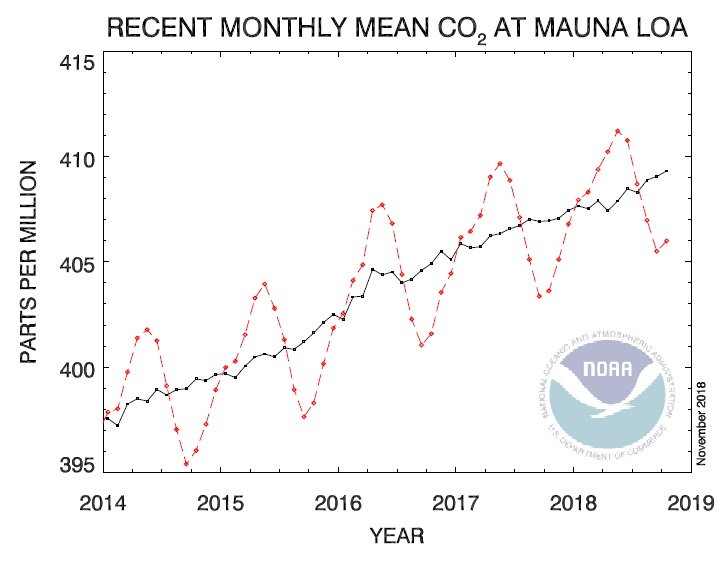
1 x
Christophe
Moderator
Moderator
posts: 79330
Registration: 10/02/03, 14:06
Location: Greenhouse planet
x 11046

Re: The latest figures from global warming


by Christophe » 29/11/18, 22:59

Interesting: each year the concentration of CO2 increases roughly half of the seasonal decline.

Why is the latter at minimum at the start of each 4th quarter? That is to say every early October? A history of biological activity?
0 x
izentrop
Econologue expert
Econologue expert
posts: 13704
Registration: 17/03/14, 23:42
Location: picardie
x 1518
Contact :

Re: The latest figures from global warming


by izentrop » 30/11/18, 00:54

Hello,
Christophe wrote:Interesting: each year the concentration of CO2 increases roughly half of the seasonal decline.

Why is the latter at minimum at the start of each 4th quarter? That is to say every early October? A history of biological activity?
Yes, clearly.
This advert does not answer exactly, but as we also know that RC causes more and more droughts and that these reduce the quantities of CO2 absorbed ... chain reaction what :x : Cry:
Terrestrial ecosystems absorb on average 30% of anthropogenic CO2 emissions, a phenomenon which moderates the increase in the concentration of this greenhouse gas in the atmosphere. However, plants need water to grow. When a drought occurs, they reduce their metabolism to preserve themselves. They then capture less atmospheric CO2: their role as 'carbon sinks' is somewhat weakened. https://www.techniques-ingenieur.fr/act ... ere-57806/


It's up to you to answer ... but fortunately there is the corrected :) https://www.annabac.com/annales-bac/l-o ... uis-50-ans
0 x
izentrop
Econologue expert
Econologue expert
posts: 13704
Registration: 17/03/14, 23:42
Location: picardie
x 1518
Contact :

Re: The latest figures from global warming


by izentrop » 01/12/18, 00:04

India. Farmers invade Delhi to shout desperation
Image
They were 30 to have walked on Bombay last March, they are “more than 000” wanting to invade the streets of Delhi, Thursday November 200 and Friday November 000.

It must be said that the profession, mired in over-indebtedness, records “more than 15 suicides per year, or 000 per month or 1 per day”.

“For seven or eight years” winters less and less cold, especially at night, which sometimes leads “to the total absence of dew” in the early morning. A dramatic situation in already arid areas such as Gujarat. At the foot of the Himalayas, the average temperature “increased by 1,24 degrees between 1951 and 2014”, or “twice as much” as anywhere else on the subcontinent. These phenomena result in “a drastic drop in crop yields”, observes The Wire
The beginnings of what lies ahead in the near future : Cry:

How will the GJs be when we get there?
0 x
User avatar
Exnihiloest
Econologue expert
Econologue expert
posts: 5365
Registration: 21/04/15, 17:57
x 660

Re: The latest figures from global warming


by Exnihiloest » 01/12/18, 16:56

izentrop wrote:... The beginnings of what awaits us in the near future : Cry:
...


"Ecological catastrophism against democracy"
"The purpose of this article is to question the specific temporal regime associated with ecological catastrophism, and in particular in its climatic variant. We seek to show that the images of the future which are used in the catastrophist discourses, which we describe and whose we analyze the different forms, produce anti-democratic political positions. Therefore, we plead for their replacement by another conception of the future, of temporality, and of time itself, the outlines of which we are sketching on a theoretical level. 'for us in no way acts to contest the depth of the ecological crises that the world is currently experiencing, but on the contrary, by bringing them back to the present on the one hand, and by showing their contradictory multiplicity on the other hand, by bringing them to light. real measure. This is how the possibility of a democratic politics of socio-ecological relations can be understood. "
https://journals.openedition.org/vertigo/16427
0 x
moinsdewatt
Econologue expert
Econologue expert
posts: 5111
Registration: 28/09/09, 17:35
Location: Isére
x 554

Re: The latest figures from global warming


by moinsdewatt » 02/12/18, 20:38


Why is the latter at minimum at the start of each 4th quarter? That is to say every early October? A history of biological activity?


This is because the southern land mass is less than the land mass of the northern hemisphere.
The minimum is reached when the biomass has filled up with CO2 in the fall.
Then there is biomass that rots and releases CO2.
1 x
User avatar
Did67
Moderator
Moderator
posts: 20362
Registration: 20/01/08, 16:34
Location: Alsace
x 8685

Re: The latest figures from global warming


by Did67 » 02/12/18, 21:31

I wonder if it is not because rather because then the emissions are reduced in the north, where the populations "which use the heating" are concentrated ????
0 x
izentrop
Econologue expert
Econologue expert
posts: 13704
Registration: 17/03/14, 23:42
Location: picardie
x 1518
Contact :

Re: The latest figures from global warming


by izentrop » 03/12/18, 00:44

On the html version, the maximums are in August, so the minimums are in November December, which is logical given the location of the measurement on Hawaii in the middle of the Pacific Ocean. https://www.esrl.noaa.gov/gmd/ccgg/trends/global.html

In this place, I doubt that the heating is very influential, on the other hand photosynthesis it is obvious, since the lung of the planet is phytoplankton much more than the terrestrial vegetation.
Although its role is less and less effective, it is sick like the oceans of having absorbed too much CO2 https://www.sciencesetavenir.fr/nature- ... ger_113441

Already noted in 2010 https://www.futura-sciences.com/planete ... ril-24616/
Whatever Exnihilo thinks, man is no stranger to it.
0 x
User avatar
Exnihiloest
Econologue expert
Econologue expert
posts: 5365
Registration: 21/04/15, 17:57
x 660

Re: The latest figures from global warming


by Exnihiloest » 03/12/18, 11:01

izentrop wrote:On the html version, the maximums are in August, so the minimums are in November December, which is logical given the location of the measurement on Hawaii in the middle of the Pacific Ocean. https://www.esrl.noaa.gov/gmd/ccgg/trends/global.html

In this place, I doubt that the heating is very influential, on the other hand photosynthesis it is obvious, since the lung of the planet is phytoplankton much more than the terrestrial vegetation.
Although its role is less and less effective, it is sick like the oceans of having absorbed too much CO2 https://www.sciencesetavenir.fr/nature- ... ger_113441

Already noted in 2010 https://www.futura-sciences.com/planete ... ril-24616/
Whatever Exnihilo thinks, man is no stranger to it.

Foreign to what? Before taking any scientific study as the gospel word, it is necessary to verify. A scientific article is far from being a sura! About the Nature article that the science sites like futura-sciences.com that you quoted, or the ecological sites, all take to heart without critical spirit, in the mode of psalmody or Gregorian chant, here is what other scientists say:

"Is there a decline in marine phytoplankton?
Boyce et al. compiled a chlorophyll index by combining in situ chlorophyll and Secchi disk depth measurements that spanned a more than 100-year time period and showed a decrease in marine phytoplankton biomass of approximately 1% of the global median per year over the past century. Eight decades of data on phytoplankton biomass collected in the North Atlantic by the Continuous Plankton Recorder (CPR) survey, however, show an increase in an index of chlorophyll (Phytoplankton Color Index) in both the Northeast and Northwest Atlantic basins ...
"
https://www.researchgate.net/publicatio ... toplankton

In front of the scientists who did not understand that science advances with small steps and that there are many false before one can affirm that one really advanced, the ideologues who do not seize publications scientists that what arrange them to place us their utopias, or the media margulins who do the same to promote their trade in catastrophism, only one attitude is possible: reasonable doubt.
0 x
izentrop
Econologue expert
Econologue expert
posts: 13704
Registration: 17/03/14, 23:42
Location: picardie
x 1518
Contact :

Re: The latest figures from global warming


by izentrop » 03/12/18, 11:29

Except denigrate, I see that you do not bring any argument which would go in your direction. Here is another article which describes well the situation concerning phyto plankton http://c3vmaisoncitoyenne.com/spip.php?article492
0 x


  • Similar topics
    Replies
    views
    Last message

Back to "Climate Change: CO2, warming, greenhouse effect ..."

Who is online ?

Users browsing this forum : No registered users and 208 guests