
The oil flow and exchange of 1973 2004 to.
Keywords: map, energy, oil, oil, flux, boats, quantity, origin, pipeline, oil pipeline, the Middle East, Europe, USA, America
Here are some maps showing the evolution of oil flows over the past 30 years. For each card we will do some brief analyzes. More precise analyzes can be made by simply observing the maps.
1) The situation in 1973
a) The card

Click to enlarge
b) Analyses
Breakdown of production in million tons and%:
- Middle East: 989 (63,26%)
- West Africa: 106 (6,78%)
- North Africa: 163 (10,43%)
- Latin America: 187,5 (12%)
- Indonesia: 69 (4,41%)
- USSR: 49 (3,13%)
Total: 1563,5 Million Tons be 12 311 million barrels or 33 million barrels per day.
In 1973, the dependence of the world, in particular of Europe, on the Middle East was almost total except for North America.
Indeed, we will be surprised by the very low imports of Arab crude oil to the USA and Canada (barely 20 Million Tons or 7,3% of their imports). National productions were, still at the time, to compensate for American demand.
The zone on which the USA depends the most are Central and Latin America (57% of their imports). This undoubtedly explains, in part, the strong implications and control of American governments during these decades on these countries.
It should also be noted that the Suez Canal is not open to oil transits and for good reason: "After the Six Day War of 1967, the canal remained closed until 1975, with a UN peacekeeping force remaining in place until 1974."
2) The situation in 1984
a) The card
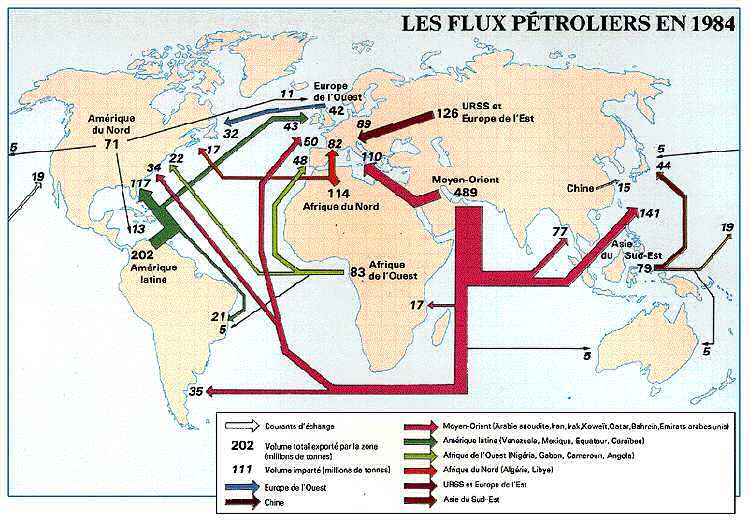
b) Analyses
Breakdown of production in million tons and%:
- Middle East: 489 (42,26%)
- West Africa: 83 (7,22%)
- North Africa: 114 (10%)
- Latin America: 202 (17,57%)
- Indonesia: 79 (6,87%)
- USSR: 126 (10,96%)
- Western Europe: 42 (3,65%)
- China: 15 (1,3%)
Total: 1150 9055 Million Tons either Million Barrels be 24,8 million barrels per day.
Between 1973 and 1984, world production fell by around 25%. This is directly linked to the price explosion. View historical oil prices.
Exports from the Middle East have fallen by more than 50% and for good reason: the creation of OPEC and its quotas, the Iranian crisis and above all increases in oil costs.
Apart from this fact, there are no noticeable changes in world production. Two new production zones appear: the North Sea and China. Strangely, the North Sea exports 3/4 of its production to North America, which still remains as independent of Arab oil as in 1973.
Global flows of oil in 1998, 2001 and 2004
Learn more and sources:
- Forum energies, geopolitics and oil
- Global oil market and consumption
- Sciences Po mapping site
- cartographic database Sience Po