What is the global consumption of primary energy, its evolution since the beginning of the industrial era and the different sources of energy used by humanity?
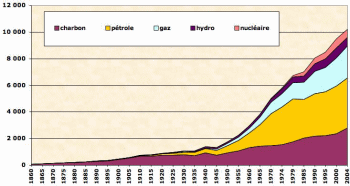
The answers to these 3 questions are in the graphic below (click on the image to enlarge):
Evolution of “commercial” energy consumption in millions of tonnes of oil equivalent. Sources: Schilling & Al. 1977, IEA et Jean-Marc Jancovici Note: 1 11 700 toe = kWh.
Findings and observations
- In 2004 world consumption was around 10 million tonnes of oil equivalent, or 000 billion kwh of primary energy.
- Smoothed over a year and all this combined energy consumption represents an instantaneous power 13,34 billion kw
- This size represents the equivalent (if everything were to be electric) of 13 340GW nuclear reactors operating at full power, 1/24 all year round. To have an idea, there are currently around 24 nuclear reactors in the world (500% of primary energy).
- Brought to the world's population (based on 6 billion) this consumption represents: 2,23 kW per capita.
- Reduced to the “rich” terrestrial population (on a basis of 1 billion), this consumption represents: 13,34 kW. Each human in a rich country therefore consumed during 2004 the equivalent of a "virtual" boiler (but very real for the greenhouse effect and the depletion of resources, except nuclear and hydroelectricity) of 13,34, 24 kW operating 24/1,36 all year round and consuming XNUMXL of oil equivalent per hour
- All this energy ends up sooner or later in the form of heat and is released into the atmosphere, thus contributing to the increase in temperatures (regardless of the greenhouse effect created by GHGs)
- Energy consumption is constantly increasing (exponentially?): Between 2000 (ie yesterday) and 2004, consumption increased by 10%!
- A new source does not replace another: the consumption of coal is 6 times greater in 2000 than in 1900 ...
- The surfaces (integration) of the different curves give an idea of the absolute energy consumption, so we consumed about as much oil between 1980 and 2004 as between 1860 and 1980.
- Energy consumption is directly linked to the earth's population (and to the GDP of rich countries), see link below.
- Nuclear power represents as much as hydropower in 2004
- Renewable energy, excluding hydropower, are (still) significant
- Non-commercial energies do not appear in this graph (wood consumed directly)
These pages have their origin on the forum of discussing : learn more and offer questions / answers about energy.
More:
- Senarii probable evolution of consumption, comparison with the population curve and CO2 concentration
- IEA publications


