What is the real price or cost of oil? What has been the evolution of prices during the last decades? How much does oil bring to those who sell it? Has energy ever been more expensive? How much does energy cost in relation to purchasing power?
In this article and the following, we will attempt to answer these questions.
Preliminary remarks.
1) By "real" price, we mean the corrected price of oil: not the price in current currency (which means absolutely nothing given the evolution of currencies) but the price in constant currency corrected by inflation .
2) A second correction will be made by relating the price of oil to that of purchasing power. Thus, we will obtain what can be called a "fair price" or at least a "fairer price" since inflation is far from taking into account all aspects of consumption. See this article.
3) Like all other energies are more or less pegged to the price of oil, the analysis also, in some measure, other energies.
Introduction Data Sources.
We shall progressively by an analysis of the following developments and figures:
1) The price of a barrel. Source: World Energy Committee and British Petroleum (BP)
2) The inflation of the dollar and the dollar / euro parity. Sources: Ministry of Industry, for Brent, the parity € / $.
3) World oil consumption. Source: French Union of Petroleum Industries.
4) The evolution of wages in France (based on the minimum wage). Source: INSEE
5) The evolution of purchasing power in France. Source: INSEE
By entering this data in a spreadsheet (OpenOffice for example, the free version of Excel), and by mixing everything well, we were able to come up with various interesting curves.
We will not detail the method for reasons of readability, but we invite you to express yourself on this one on the subject of the forum: Historical earnings and oil revenues to between 1920 2006.
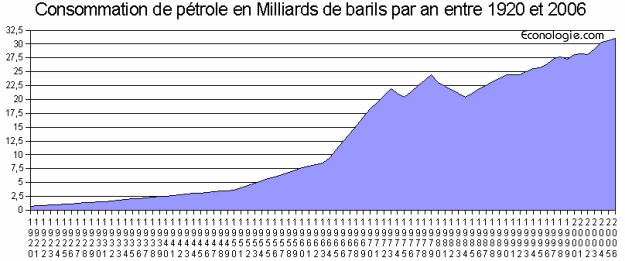
1) Evolution of world oil consumption between 1920 and 2006
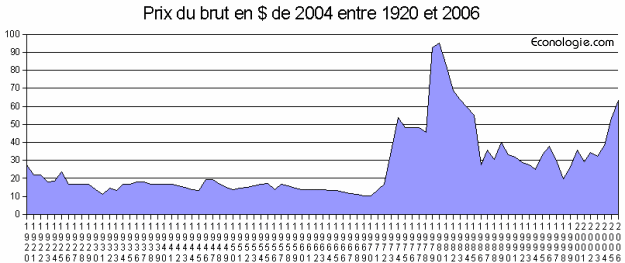
2) Price per barrel of crude between 1920 and 2006 in constant 2004 dollars
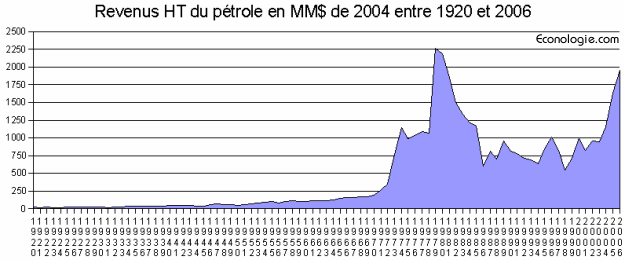
3) Evolution of oil revenues excluding tax between 1920 and 2006 in constant 2004 dollars
A small calculation lesson = 3 2 1 *
This curve is the simple multiplication of 1 curves) and 2).
Some analyzes:
- Consumption has little importance in the revenues of oil companies, it is above all the price of crude which
determines their income. A high crude price is obviously favorable to their business since there is no "serious" alternative
the oil that can be put in place very quickly. - This curve is greatly reduced because it only concerns the crude petroleum product (see *). The real "revenues" of oil must be multiplied by a coefficient 2 to 3 given the numerous taxes on this product.
In other words: $ 1 of crude oil brings in between $ 2 and $ 3 all taxes included for those who exploit it (States included).
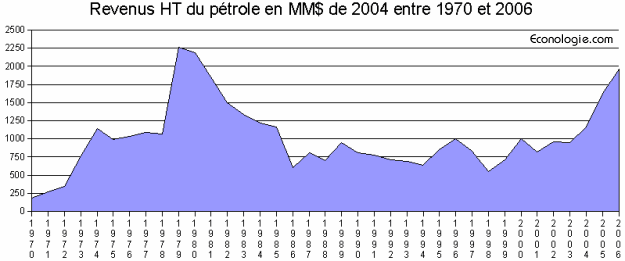
4) Evolution of oil revenues on 1970-2006 period.
Between 1920 and 2006, oil revenues are relatively constant, the post-1970 events and the awakening of emerging countries set up a new world which is changing very rapidly.
compared to the stability of the 50 years prior to 1970, even World War II is not "visible" on these curves ".
The following curve, which is very variable and almost “sawtooth”, clearly shows that the “low” stability of crude prices is definitely a thing of the past and that, given the increasing demand, the
trend should only be on the rise ... although, as we will explain in a following article: the price of energy compared to purchasing power is not (unfortunately for econology), in 2005, as high as the media want us to believe!
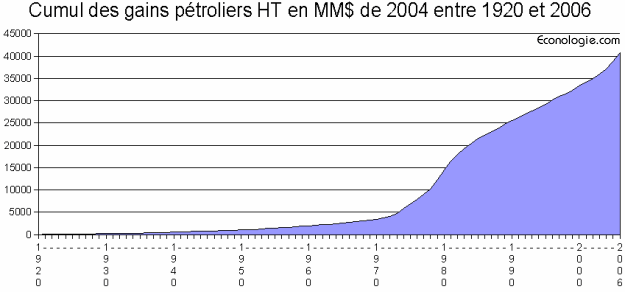
5) Accumulated oil revenues.
To conclude this article, here, for the same period in 1920 2006, accumulated oil still gains tax and dollar 2004 obviously.
Some analyzes:
- Oil companies' revenues are constantly increasing: it is linked to the increase in demand
- Oil brought in nearly $ 41 billion in 000 between 2004 and 1920
- This amount is largely minus for the same reasons as cited in 3) (see *)
- This sum, minus recall, is to compare the cost of 5500 billion warming Stern Review thus seem ridiculous
- A comparison to the evolution of world GDP would be useful (see *)
- Oil is indeed the spearhead of the global economy, not to mention indirect wealth.
* No tax or derivative product is taken into account on this curve, let alone the wealth (in the sense of GDP) that these barrels of oil have allowed to create.
It would be very risky and daring to embark on a correction calculation of wealth creation oil according to the criterion of GDP.
Indeed; the data being largely too variable taking into account the evolution over time (an oil dollar currently creates more GDP than 30 years ago) and the global nature (geographic diversity) of these data.
Moreover, it is very difficult to estimate world GDP before 1950 (at least we did not find it, help would be welcome).
More:
- Discuss the method on forums
- Oil compared to purchasing power
- Retail in oil earnings since 2002


